
Skip Navigation and Go To Content

machine learning hackathon logo

SBMI Healthcare Machine Learning Datathon

September 14 – 15, 2019

School of Biomedical Informatics (SBMI), University of Texas Health Science Center at Houston (UTHealth)

E6 Level, 7000 Fannin St., Houston, TX 77030

Co-organizers: Xiaoqian Jiang, Yejin Kim

Project Manager: Marijane deTranaltes

Architectural/Content/Logistical Support: Judy Young, David Ha, Luyao Chen, Queen Chambliss, Marcos Hernandez, Angela Wilkes


The 1st SBMI Healthcare Machine Learning Hackathon has successfully finished. The first place winner was Rice University PhD student, Qiang Zhang. Bishal Lamichhane, another Rice University PhD student and Carroll Vance, a University of Houston Computer Science undergraduate student, earned second and third place respectively. Thanks for all the dedication and participation. We hope to see you again at the next Hackathon. For more pictures, click here.


ABOUT DATATHON


The 1st SBMI Healthcare Machine Learning Hackathon is calling for the participation of capable, motivated undergraduate and graduate students from Gulf Coast Consortia institutions and other Houston area universities. Come join us for this great opportunity to challenge your coding skills, meet new people, and enjoy interacting with other young hackers! This 24-hour Hackathon has been organized by the Center for Health Security and Phenotyping (CHSP) at the UTHealth School of Biomedical Informatics and the Texas Institute for Restorative Neurotechnology. The very first event of our Hackathon series is sponsored by Elimu Informatics, Inc., which is providing a $1,200 prize to the winner, along with some great swag for participants.


THEME


Annually, approximately 3,000 people in the United States die from Sudden Unexpected Death in Epilepsy (SUDEP) because of a shutdown in brain, cardiac, and breathing function. One way to potentially determine risk is the accurate identification of certain electroencephalographic (EEG) features after epileptic seizures. Unfortunately, human visual analysis of such features is unreliable.

The theme of this Hackathon is to compete on the development of algorithms to detect the end of postictal generalized EEG suppression (PGES) by identifying the onset of slow activity after a generalized tonic-clonic (GTC) seizure. Participants should detect the commencement of slow activity no later than a few seconds after onset. The input consists of signals from multiple channels monitoring the electrical activity in various regions of the brain. Note that there is a lot of noise due to the environment (e.g., patient motion, bed relocation, etc.); also, muscles complicate input via artifacts that are irrelevant to the brain. Experts have expended a good deal of effort to identify and monitor a number of critical patterns, which often requires considering multiple channels.

In this machine learning challenge, we ask the participants to build models (in a justifiable manner) and evaluate final performance, based on accuracy; additional consideration will be given to model interpretability, should participant performance be tied. See this for more details on the detection of PGES.
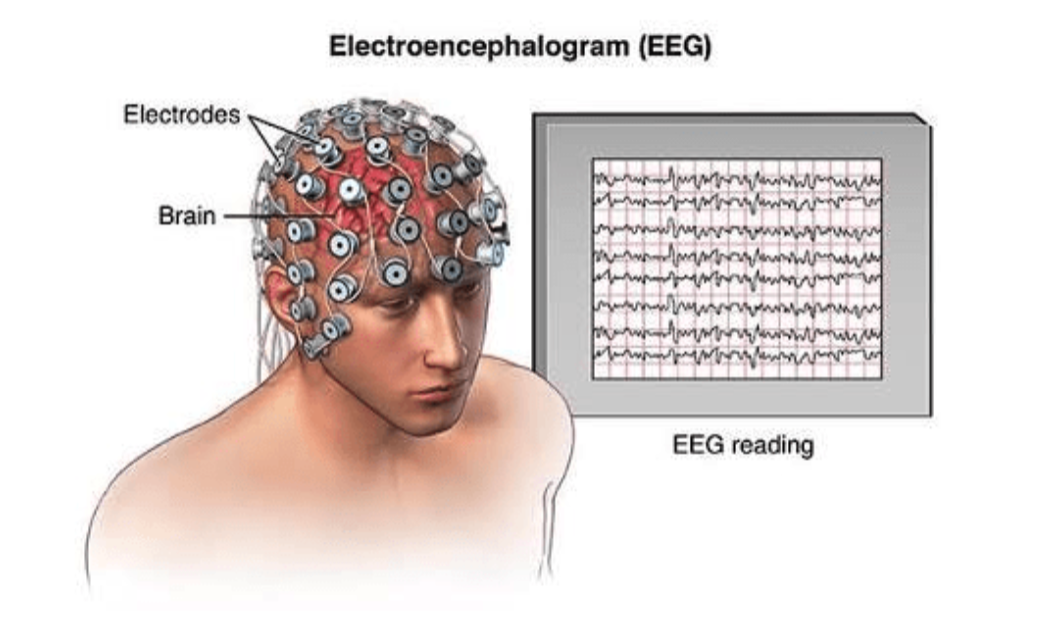

Figure 1. EEG signals from brains. Source: wetalkuav


PROBLEM DESCRIPTION


Objective. The objective of this Hackathon is to detect the onset of slow activity after a seizure (Fig. 2). The detection of onset should be done no later than 3 seconds (i.e., latency) after actual onset. Note that detecting onset after the latency period would be trivial in a real-time detection scenario.

Figure 2. EEG suppression and onset of slow activity.

Signal. For the purposes of this competition, we will focus on EEG signals, which is key to observing brain activity. The EEGs are sampled from multiple electrodes at a sampling rate of 200 Hz, which captures temporal and spatial patterns of the brain (Fig 3). In this competition, we will only focus on 13 electrodes (Fp1, Fp2, O1, O2, F7, F8, T7, T8, P7, P8, Fz, Cz, Pz), as well as pairwise offsets of two adjacent electrodes (i.e., a so-called montage).
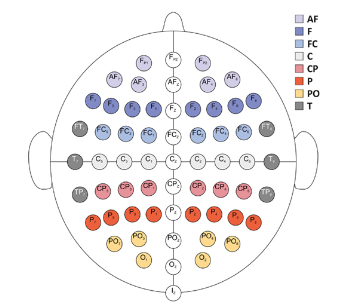
Figure 3. Electrodes for EEG signals. Source: Grabner, Roland H., and Bert De Smedt. "Oscillatory EEG correlates of arithmetic strategies: a training study." Frontiers in psychology 3 (2012): 428.

Typical patterns of suppression and slow activity are shown in Fig. 4. Generally speaking, suppression patterns are stable, with no apparent fluctuation (Fig. 4 left); whereas, a slow activity pattern shows moderate fluctuation (Fig. 4 right).
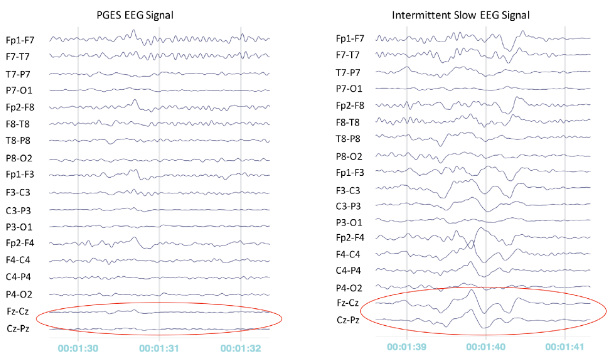
Figure 4. Comparison between suppression signal (left) and slow activity signal (right).

Physicians usually review the EEG signals retrospectively, manually annotating the onset of slow activity. However, EEG signals can be very noisy and there are multiple sources of contamination (Fig. 5), such as heart activity, eye movements, and facial muscle movement, etc. Go here for more details. In consequence, we need an automated tool to support physicians in effectively handling noisy signals in order to derive useful patterns that will enable detection of the onset of slow activity.
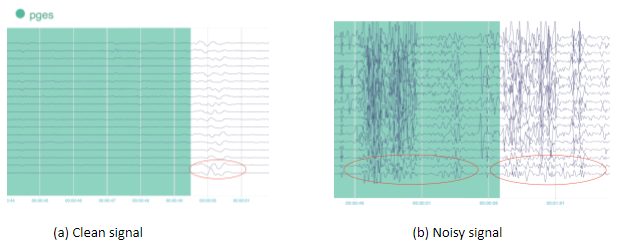
Figure 5. Two examples of EEG signals. (a) With clean signals, slow activity is easy to detect visually; (b) EEG signals during suppression and slow activity are very noisy, due to various artifacts.


EVALUATION


Figure 6. Segments of signals for evaluation.

Submissions are judged on the accuracy of detection. Participants must identify whether given short segments of EEG signals (i.e., clips) indicate the onset of slow activity (Fig. 6). Clips in the test file are variable in length. The slow activity clip does not include slow activity signals beyond 3 seconds after onset. Participants should submit a solution file in a CSV format with classification for each test clip. The file should contain a header and have the following format:


DATA DESCRIPTION


Train data are in a single csv file (train.csv) with format below:

For each patient, the signals have the aforementioned 13 electrodes (fp1, fp2, …, pz) and 10 precalculated pairwise offsets (fp1-f7, f7-t7, …, cz-pz) for reference. Label==1 refers to the after slow activity and label==0 refers to before slow activity. The signals were truncated to the first 180 seconds after the seizure ends; the onset of slow activity primarily occurs during this period.

Test data are in a single csv file (test.csv) with the format below:


AGENDA


Location:

School of Biomedical Informatics (SBMI), University of Texas Health Science Center at Houston (UTHealth)
UCT Classrooms 612 & 614 (6th Floor)
7000 Fannin St., Houston, TX 77030

Please note: Contestant on the leaderboard will be invited to submit paper with us to a special issue of BMC Medical Informatics and Decision Making

September 14, 2019

  • 10:00am - Opening remarks by Dr. Xiaoqian Jiang and SBMI Dean Jiajie Zhang
  • 10:30am - Hackathon announcements
    • Dr. Samden Lhatoo: Introduction to the problem
    • Dr. Aziz Boxwala: Greetings from the sponsor
  • 11:00am - Warm up
    • Environment preparation
  • 12:00pm - Enjoy the Hackathon!

September 15, 2019

  • 12:00pm - End of Hackathon
  • 1:00pm - Announcement of the top three participants and the winner
    • Mrs. Marijane deTranaltes
  • 1:15pm - Demonstrations


RULES


  • Participants are required to submit source codes (e.g., Jupyter Notebook) in a self-contained manner.
  • Downloading data from our server and saving those data locally for use after the competition is strictly prohibited.
  • Privately sharing data outside of our provided environment during the competition is not permitted.
  • Participants must use an algorithmic approach to classify the segments. Any changes to the methodology must be done in an automated way, so that the approach can be generalized to new subjects.
  • Classification must be performed via algorithm; a visual review of data segments is not permitted.
  • Use of external data is permitted, provided it does not directly relate to the clip labels in the official competition data.
  • All participants are asked to prepare summary slides that will describe their models.
  • The top three participants will be asked to give a short presentation and the top ten participants on the leaderboard may have an opportunity to publish their results in the special issue of a journal (under negotiation).
  • The participant may submit a maximum of 10 entries; the entry with the best performance counts for the purposes of final judgment.


PRIZE


Winner: $1,200


FAQS


FREQUENTLY ASKED QUESTIONS

Undergraduate students and Graduate students currently enrolled in their first/second year of a master’s program or in the first two years of a Ph.D. program from institutions within the Gulf Coast Consortia (inclusive of UTHealth, MDACC, UH, Rice, TAMU, UTMB, IBT, and Baylor, etc.). In addition, qualifying students from the Houston area (e.g., HBU, SHSU, TSU, PVAMU, University of St. Thomas, UH-Clear Lake, UH-Sugar Land, and UH-Victoria, etc.) are encouraged to apply. Students affiliated with the Center for SUDEP Research are ineligible to participate.
No, this Hackathon is completely free!
Just bring your laptop, charger, student ID, and your brilliant mind—as well as anything that can help you during the competition (e.g., earbuds, sweaters/blankets, and a sleeping bag if you plan to take a nap, etc.).
This is a coding Hackathon. You are expected to have mastered basic programming skills and have knowledge of machine learning.
Yes! There will be meals, snacks, drinks, coffee and more!
Yes! In addition to a $1,200 prize for the winner, we have partnered with Elimu Informatics to provide great swag/prizes for the event!
The Hackathon will be held at the University Center Tower (UCT) of UTHealth in Houston. The address is Room 614, 7000 Fannin St., Houston, TX 77030. Public parking is available in the UCT garage; parking will be validated at the event. If you travel via Houston METRORail (the TMC Transit Center Station of Red Line is just across the street) or bus, no reimbursement will be provided.
Our panel of experts is composed of faculty members from UTHealth School of Biomedical Informatics. Your project will be judged via automated leaderboard program; each contestant can only submit 10 times. The top 3 contestants will be asked to make a short presentation on their solution at the end of the event.
If you have a question that is not referenced here, please contact Dr. Xiaoqian Jiang

RELATED LITERATURE:

  1. Theeranaew, Wanchat, et al. "Automated detection of postictal generalized EEG suppression." IEEE Transactions on Biomedical Engineering 65.2 (2017): 371-377.
  2. Vidyaratne, Lasitha S., and Khan M. Iftekharuddin. "Real-time epileptic seizure detection using EEG." IEEE Transactions on Neural Systems and Rehabilitation Engineering 25.11 (2017): 2146-2156.
  3. Kulkarni, Prathamesh M., et al. "A deep learning approach for real-time detection of sleep spindles." Journal of neural engineering 16.3 (2019): 036004.
  4. Lawhern, Vernon J., et al. "EEGNet: a compact convolutional neural network for EEG-based brain–computer interfaces." Journal of neural engineering 15.5 (2018): 056013.
  5. Schirrmeister, Robin Tibor, et al., "Deep learning with convolutional neural networks for EEG decoding and visualization." Human brain mapping38.11 (2017): 5391-5420.
  6. Kaggle competition on seizure detection

EXPERT COMMITTEE


Dr. Samden Lhatoo
Dr. Guo-Qiang Zhang
Dr. Shayan Shams
Dr. Licong Cui
Dr. Shiqiang Tao
Dr. Xiaojin Li
Dr. Deevakar Rogith