
Registration Deadline: March 25th, 2021
Competition Date: March 27th – 28th, 2021
Co-organizers:
Shayan Shams, Yejin Kim, Xiaoqian Jiang, Sean Savitz
In 2017, 7.8 million adults in the U.S. reported having survived a stroke. While deaths attributable to stroke have declined, stroke remains a leading cause of morbidity and disability. By 2030, stroke-related costs are expected to reach $183 billion. Despite early treatment, stroke survivors often have a severe long-term disability including both physical and cognitive issues that require constant monitoring and care from the community. Rehabilitation is essential to recovery and begins soon after the injury when the brain is especially receptive to processes that can enhance repair . The appropriate quantity, quality, and timing of rehab therapy is unknown to optimize outcomes and remedy disabilities effectively. An accurate prediction of the functional and cognitive outcome at the acute stage of stroke is important for a personalized rehabilitation plan and improving communication among patient, family, and clinicians regarding possible outcomes and expectations.
The theme of this Datathon is to ask participants to compete on the development of algorithms to predict changes in cognitive and Functional Independence Measure (FIM) scores (18 subcategories) during inpatient rehabilitation (difference between admission FIM score and discharge for each subcategory). FIM score is extensively used across North America to measure disabilities. It includes eighteen subcategories of assessment items, grouped in six sections. The FIM assesses both motor and cognitive functions, and an increasing FIM score implies functional improvement while a decreasing score implies a decline in the patient's functional status.
FIM score for each category range from 1 to 7 where:
| 7 | 6 | 5 | 4 | 3 | 2 | 1 |
|---|---|---|---|---|---|---|
| Complete Independence | Modified Independence | Supervision | Minimal Assistance | Moderate Assistance | Maximal Assistance | Total Assistance or not Testable |
Objective
The participants are expected to develop algorithms to jointly predict changes in FIM score during inpatient rehabilitation in each subcategory from admission to discharge.
Predictive variables
The predictive variables consist of both continuous and categorical variables. While a great deal of effort has been invested in organizing and cleaning the dataset, participants are expected to be able to use novel strategies to deal with missing values in predictive variables.
In this machine learning challenge, we ask the participants to build models (in a justifiable manner) and evaluate final performance, based on L1 (Manhattan) distance
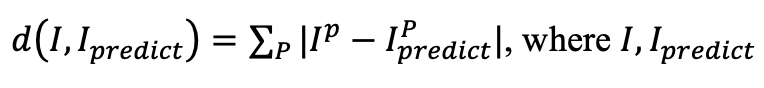 represent the actual and predicted changes of FIM scores (i.e., P subcategories). If there are ties in the performance, additional consideration will be given to model interpretability and identification of predictive variable importance, should participant performance be tied.
Example of final output:
| ID | Eating-Change | Bathing-Change | Misc-Change 1 | Misc-Change 2 | Misc-Change 3 | Memory-Change |
|---|---|---|---|---|---|---|
| 100 | 5 | 7 | 1 | ... | 3 | 2 |
| 101 | 2 | 7 | 3 | 2 | 5 | |
| 102 | 4 | 3 | 1 | 1 | 2 |
Data Description
Train data are in a single CSV file (train.csv) in the below format:

The label contains 18 FIM subcategory and participants are expected to predict a vector of (18) where each value in the vector represents the difference in admission FIM score and discharge for each subcategory.
A total of $1,500 sponsored by UTHealth